Donald Trump’s top economic advisor claims the President has weaponised tariffs to ‘persuade’ other nations…
The True Face of “Aid” C. P. Chandrasekhar and Jayati Ghosh
The Organisation for Economic Cooperation and Development (OECD), predominantly a club of rich market economy countries, has just released preliminary estimates of the flow of Overseas Development Assistance (ODA) or “aid” from 31 members of its Development Assistance Committee to developing country recipients. The figures seem to suggest that nothing really changes in that domain. The promise held out in a UN General Assembly resolution of 1970 that “Each economically advanced country will progressively increase its official development assistance […] and will exert its best efforts to reach a minimum net amount of 0.7% of its gross national product […] by the middle of the Decade” still remains unrealised.
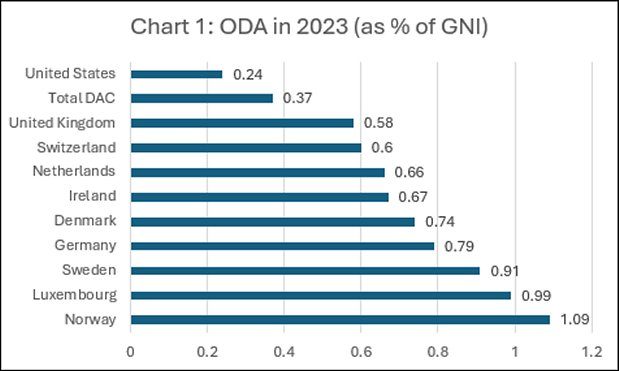
As Chart 1 shows, there are only five countries that have realised or exceeded that target. The average for all DAC members is just above half of that modest target. And the figure for the United States, the world’s largest economy, is a pathetic 0.24 per cent. The contribution of the countries that realised the target fades in importance once we realise that they together accounted for just $51.5 billion of the total flow of ODA from DAC countries of $223.7 billion in current prices in 2023. That was less than flows of $66 billion from the US, which contributes close to 30 per cent of the total. In the flows from the five countries that met the ODA target, Germany, with $36.7 billion, accounted for $51.5 billion or more than 70 per cent.

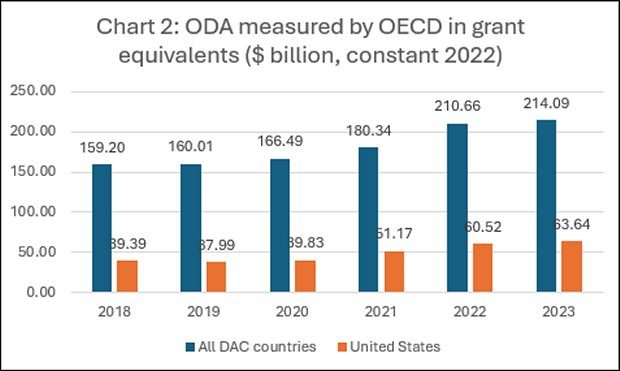
More recently, however, the DAC ‘donors’, including laggard United States, seem to be getting their act together. There has been a noticeable rise in the volume of ODA flows from the DAC during the three years ending 2023. ODA measured by the OECD in grant equivalents at constant 2022 prices rose from $166.5 billion in 2020 to $180.3 billion in 2021, $210.7 billion in 2022 and $214.1 billion in 2023 (Chart 2). Flows from the US too rose from $39.8 billion in 2020, to $51.2 billion in 2021, $60.5 billion in 2022, and $63.6 billion in 2023.

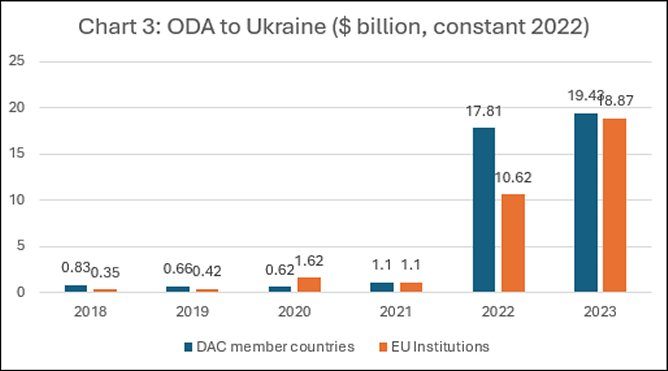
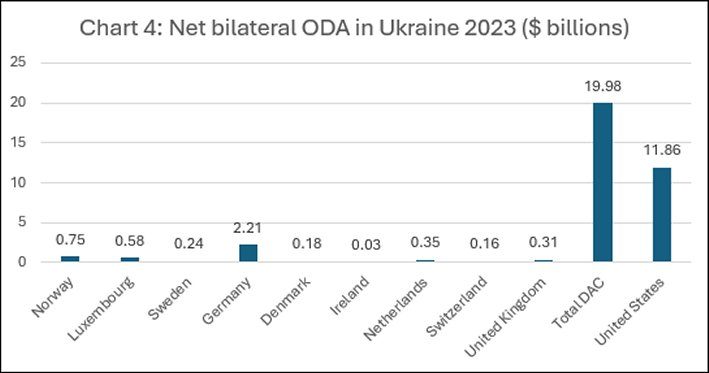
However, a more disaggregated look at the destination of these flows suggests that there is little reason to applaud this improvement. As Chart 3 shows, the two years 2022 and 2023 were marked by a steep rise in ODA flows from the DAC members to Ukraine, from $1.1 billion in 2021 to $17.8 billion in 2022 and $19.4 billion in 2023. Moreover, besides bilateral flows from member governments, flows of “development assistance” from EU institutions (not governments) also rose from $1.1 billion in 2021 to $10.6 billion in 2022 and $18.7 billion in 2023. Among member governments, the US was the dominant contributor, accounting for close to 60 per cent of the flows of ODA from the DAC members to Ukraine (Chart 4).

The sharp and sudden spike in flows to Ukraine in 2022 and 2023 is not difficult to explain. To recall, it was on 24 February 2022 that Russia chose to invade Ukraine, leading to a war in which Ukraine’s response was completely dependent on military aid from the US and Europe. Having been partly responsible for the failure of efforts to arrive at a mediated settlement of the conflict triggered by official Russian perceptions of threats to the country’s integrity, the West has backed Ukraine in a war that has not ended as soon as expected. Thus, the increase in ODA from the DAC countries is not “development aid”, but the cost of expansionism by proxy of the United States and its European allies.

Paradoxically, with the US and EU allied in an effort to win a war against Russia fought by proxy Ukraine, there has been much hand wringing about the inadequacy of support from them for Ukraine’s war effort. Especially since that country appears to be failing in its effort to push back against Russia. Domestic politics, the genocidal Israeli attack on Gaza, and the widening of the conflict in West Asia, have resulted in the waning of US support for the Ukrainians. A $60 billion package of US military support has not progressed through the House of Representatives. What is more, Trump has made it clear that he sees the conflict in Ukraine as Europe’s problem, which the European members of the North Atlantic Treaty Organisation (NATO) must pay for.
European countries have been promising to step up their contribution, but differences on the size and form of that support persist. In January, the EU agreed on a package of support totalling around $55 billion, but delivery has been slow. A call from Estonia that NATO countries must commit to provide support to Ukraine amounting to 0.25 per cent of their GDP has few takers. But the call makes the priorities clear. If aid is to increase, it will only be for strategic purposes that would not meet the requirements of “development aid” as properly defined. The recent increases in flows included in the DAC aid figures only confirm that perception. But even that spurious inclusion does not help take average aid levels anywhere close to the promise made in 1970.
Even the observed increase in support to Ukraine is not driven by purely geopolitical considerations geared to containing Russia. Rather it is partly influenced by pressures from the US military-industrial complex and arms producers in the OECD countries. Military “aid” for Ukraine, which involves no non-Ukrainian “boots on the ground” but only supply of military equipment and ammunition, generates substantial demand for this military-industrial complex that produces those weapons and the needed ammunition. According to one estimate, Ukraine became the world’s third biggest arms importer in 2022 and was ranked fifth among the arms export destinations of the United States. The United States was the major supplier of arms to Ukraine in 2022, and as per the trade-indicator values (TIV), based on known unit production costs of different kinds of equipment collated by the Stockholm International Peace Research Institute, Ukrainian arms imports from that country amounted to 917 million TIV in that year. The corresponding figures were 297 for Germany and 276 for the UK. They were the leading sources of imports, other than Poland with 466 TIV. A lot of “aid’ was circling back to boost profits of the military -industrial complex.
That is a stark and telling revelation of the real purpose of what is euphemistically identified as ‘philanthropic’ aid.
(This article was originally published in the Business Line on April 15, 2024)
