Many in the West, of the political right and left, now deny imperialism. For Josef Schumpeter,…
The Unbalanced World Economy C. P. Chandrasekhar and Jayati Ghosh
Current account imbalances have been blamed in the past for creating external vulnerabilities that can lead to financial crises. In the run-up to the Global Financial Crisis (GFC) of 2008, for example, the large current account deficits of the US—matched by current surpluses of China and Germany—were widely seen as proximate reasons for the fragility that generated the crisis.
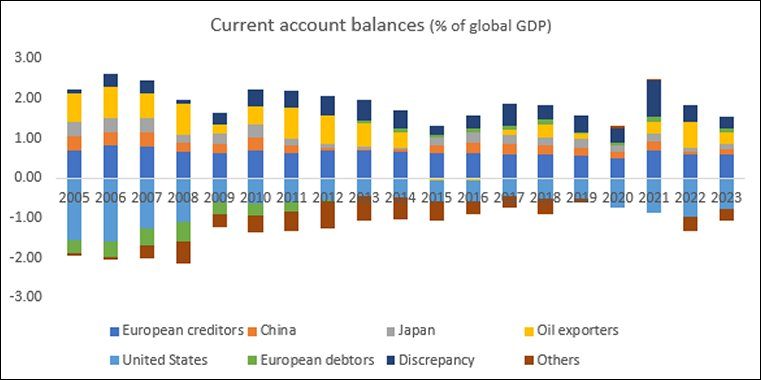
The recovery thereafter was associated with smaller current account deficits, although the recent period has once again seen an increase. However, newer forms of imbalance are worth noting—most of all, the increasing values of the “discrepancy” in current account data, which are generally recognized to reflect illicit financial flows.
Figure 1

Source: IMF World Economic Outlook, October 2023
Note: European creditors are Austria, Belgium, Denmark, Finland, Germany, Luxembourg, The Netherlands, Norway, Sweden, and Switzerland. European debtors are Cyprus, Greece, Ireland, Italy, Portugal, Slovenia, and Spain. Oil exporters are Algeria, Azerbaijan, Iran, Kazakhstan, Kuwait, Nigeria, Oman, Qatar, the Russian Federation, Saudi Arabia, the United Arab Emirates, and Venezuela.
Figure 1 shows the broad contours of the current account balances since 2005, and provides a number of interesting insights. First of all, the largest of the deficits until the GFC was clearly that of the United States, followed by deficits in European debtor nations. The rest of the world, including all developing countries other than China and oil exporters, were in deficit but these were tiny in relation to global GDP. Meanwhile, in terms of the corresponding surpluses, China had a relatively small role, only slightly more than Japan, and European creditor countries led by Germany were much more significant. But the biggest share of surpluses was held by oil exporters.
The Chinese surpluses shrank after 2010 (in relation to global GDP, not in absolute terms) while those of European creditors and oil exporters remained large. European debtor countries were forced into balance or surplus from 2012. Meanwhile, other economies—mostly low or middle income countries—that were forced into deficit during the Global Recession, continued to run deficits in the decade after 2010, enabled by the liquidity expansion in the advanced economies that enabled such deficits to be financed, mostly by private capital flows.
The Covid-19 pandemic dramatically put a stop to such flows, and to the ability of these countries to run current account deficits, so that once again the US was the main source of current account deficits globally. In these years the “discrepancy” in current account balances ballooned, pointing to sharp increases in illicit flows as income and wealth inequality worsened sharply.
Figure 2

Source: IMF World Economic Outlook, October 2023
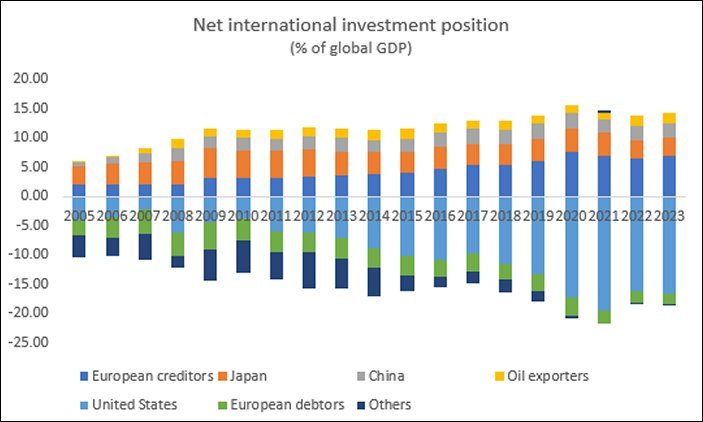
However, another imbalance that has been developing is worth noting, and this relates to the net international investment position. This does reflect current account imbalances, but not fully, because this feature also incorporates the inequalities inherent in international capital markets. This affects the terms on which capital moves and therefore the net asset/liability position. In recent years in particular, the US has overwhelmingly dominated as net debtor. The largest positive positions are increasingly held by European creditors, followed by Japan (even though Japan’s current account surpluses have shrunk and been relatively small recently, there is the legacy of past investments by Japan). The net debt of “others” including most of the developing world, increased from 2010 as noted earlier, but then reduced significantly as they found it increasingly difficult to get new credit. European debtors continue to have significant negative positions, also because they are still able to access debt.
Figure 3

Source: https://www.imf.org/external/datamapper/GGXWDGNGDP@WEO/OEMDC/ADVEC/WEOWORLD
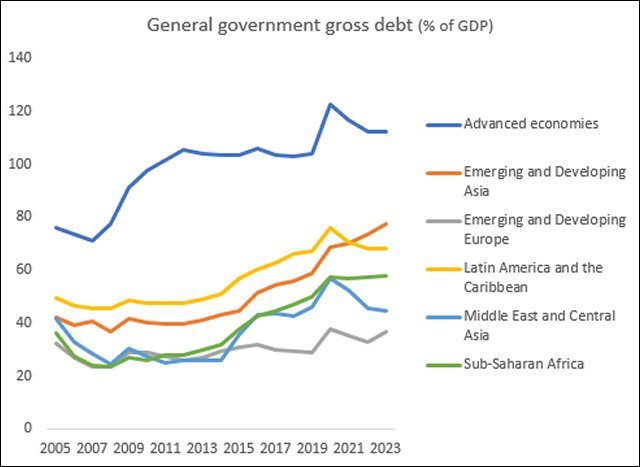
The US is therefore the largest debtor country on earth by a significant margin, but the “extraordinary privilege” of holding the global reserve currency has meant that it has not had to suffer rising spreads on its sovereign debt even when it dramatically increases its public and external debt. In fact, all the advanced economies have been able to increase their levels of public debt hugely especially from 2020, without generating much concern from the financial markets.
Figure 3 shows that the average debt of the advanced economies (as share of GDP) has not only been much higher than that of developing countries across all regions, but has also sharply increased over the past decade and especially during the pandemic. Most of the developing regions have been much more restrained (or constrained) in terms of public spending, and so public debt ratios did not rise much even when public revenues went down.
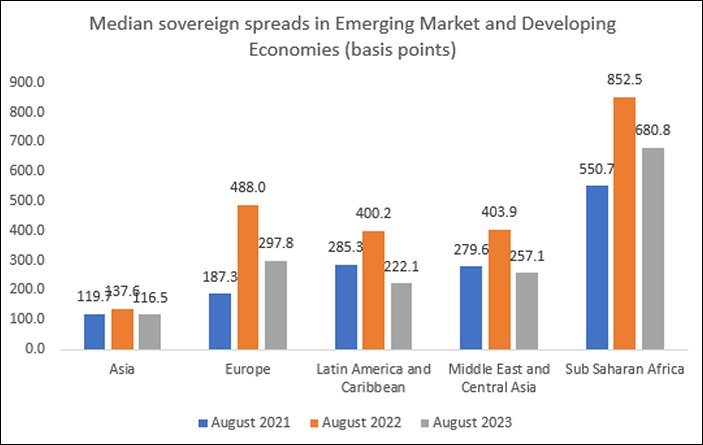
However, this fiscal restraint did not help in making financial markets more responsive. Rather, there have been dramatic increases in sovereign bond spreads (relative to US Treasury bonds) across all developing regions other than Asia. The worst affected have been countries in sub Saharan Africa, even though their public debt indicators are well below anything typically considered to be problematic. This region contains many countries now suffering moderate or severe debt stress, which is really the result of the cost of borrowing rising dramatically for them as the advanced economies have tightened monetary policies and raised interest rates.
Figure 4

Source: IMF World Economic Outlook, October 2023
This points to the more fundamental imbalance in the global economy: the financial imbalance that causes capital flows that have nothing to do with needs, “fundamentals” or growth potential, and everything to do with relative power.
(This article was originally published in the Business Line on December 11, 2023)
