Even Western financial outlets now warn of the beginning of the end of dollar dominance.…
The Changing Structure of Global Imbalances C. P. Chandrasekhar and Jayati Ghosh
The global distribution of surpluses and deficits in the balance of payments, or the excesses or shortfall in foreign exchange earnings vis-à-vis expenditures, has for multiple reasons been in constant flux. This has implications for the directions in which capital must flow or surpluses must be recycled to deficit countries to ensure global stability and prevent the disruption of development in those countries. One factor that influences the distribution of surpluses and deficits is the uneven development of capitalism with a small set of ‘advanced economies’ at one pole recording surpluses and a large number of less developed or underdeveloped countries recording deficits. This changed, however, when starting in the 1970s, the United States began recording deficits, as it lost competitiveness in trade. In addition, the oil shocks of the 1970s in the form of a spike in prices resulted in a widening of the current account surpluses of the oil exporting countries. These factors blurred the distinction between surplus earning advanced economies and deficit burdened low- and middle-income countries (LMICs).
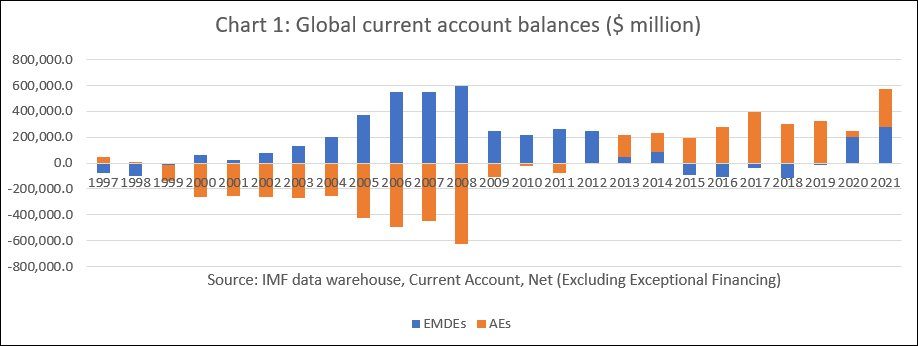
That transformation has taken on new forms in recent years. As Chart 1 shows, the years between the Southeast Asian financial crisis of 1997 and the North Atlantic financial crisis of 2008 saw a significant transformation of the current account of countries identified by the IMF as “Emerging Market and Developing Economies” (EMDEs), as they were forced to or voluntarily attempted to reduce dependence on capital inflows. The current account balance recorded by this group of countries was transformed from a deficit of $98.1 billion in 1998 to a surplus of $59.8 billion in 2000, after which that surplus rose to a peak of $594 billion in 2008. It was after the 2008 financial crisis that the surplus shrank before it turned into a deficit of $89 billion in 2015.

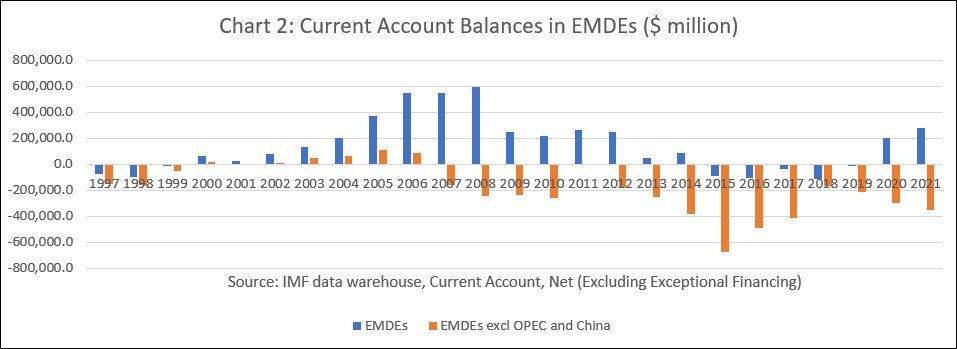
However, individual countries tend to excessively influence the value of the current account balance of different groups of countries. In the case of the EMDEs that country was China, with its large and consistent current account surpluses. A second set of countries influencing the overall EMDEs figure was the OPEC group which experienced surpluses of varying magnitudes depending on the state of oil prices. But as Chart 2 shows, even if we exclude China and the OPEC countries, the current account balance of the remaining EMDEs displayed a declining trend from 1997 to 1999, turned into a surplus in 2000, with that surplus rising from $18.8 billion $106.5 billion in 2005, before declining again and turning into a deficit in 2008. This temporary evidence of strength in the balance of payments of the LMICs (excluding China and the OPEC nations) was largely on account of the commodity supercycle (especially between 2003 and 2007) that led to a sharp rise in prices of commodities exported by less developed countries, driven by demand from China. Such periods of significant increases in commodity prices are few and far between, making that experience more the exception. Starting from crisis year 2008, the deficit of these EMDEs (excl China and OPEC) rose from a three-year average of $247.8 billion during 2008-10 to an average of $526.7 billion during 2015-17, with deficit continuing at relative high levels thereafter.

Part of the reason why these less fortunate EMDEs were able to sustain these high deficits was the relative ease of financing them with capital flows from the advanced nations that had responded to the 2008 crisis with large infusions of cheap liquidity through the adoption of a monetary policy stance involving “quantitative easing” (or bond purchases by the central bank) and near zero interest rates. Using that opportunity, countries financed bigger deficits, accumulating in the process large external debts that became difficult to service when consecutive shocks, Those shocks included, the Covid pandemic with its adverse impact on export revenues and remittances, the fall-out of the Ukraine war in the form of speculative increases in the prices of fuel and food, and the hikes in interest rates in the advanced economies (AEs) in response to the return of inflation after four decades.
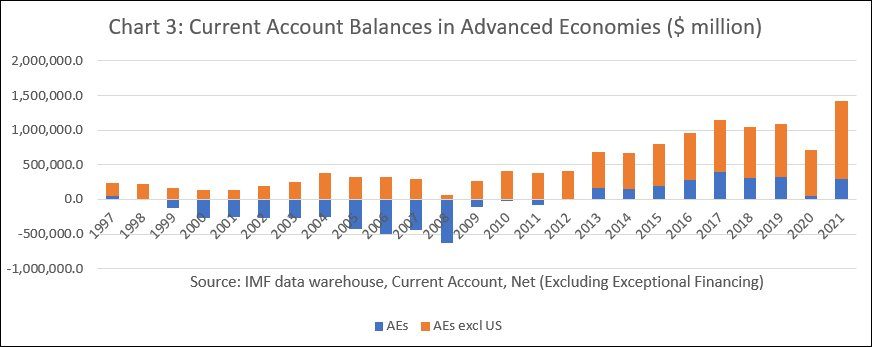
As compared to the movement from small surpluses to large deficits in the case of the EMDEs (excl China and OPEC), the AEs have seen a shift from rising deficits during the years 1999 to 2008 (Chart 3), to sharply falling deficits and the emergence of significant surpluses between 2013 and 2021. Here too the aggregate figure for the group has been pulled down by the large and persisting current account deficit of the United States, which benefited both from being the home to the dominant reserve currency that can be spent at will, and by the safe haven character that reserve currency status gave the country, attracting large inflows of capital into dollar denominated financial assets. If the US is excluded, then the current account balance of the AEs is consistently in surplus and rises sharply from $70.9 billion in 2008 to $113.7 billion in 2021.

These trends in the balance of payments have been accompanied by financial flows which too have seen significant changes. One change is that flows from governments in the advanced economies that are members of the Paris Club of creditors have been declining, with much of the official flows from these countries being mediated through the multilateral financial institutions. The second is a sharp rise in private capital flows, from commercial banks and private bondholders in search of yields from the advanced capitalist economies to the low- and middle-income countries. The third is that high growth and large current account surpluses in China have been accompanied by significant bilateral flows from China to the deficit-burdened less developed countries.
These changes have made it extremely difficult to generate agreement on the debt forgiveness needed for the poorest countries to stabilise their balance of payments and address structural issues that make their balance of payments fragile. In the event, adjustment has taken the form of austerity in the debt stressed countries, which reduces employment and real incomes of the already poor to curtail imports of essentials in order to reduce deficits. That this is underway is clear from the fact that the current account deficit of the EMDEs excluding China and the OPEC has fallen from an average of $526.7 billion during 2015-17 to $289.5 billion during 2019-21. That is the brutal form in which the debt crisis is being ‘resolved’ in an unequal world order.
(This article was originally published in the Business Line on March 20, 2023)
