Donald Trump’s top economic advisor claims the President has weaponised tariffs to ‘persuade’ other nations…
Carbon Emissions and Climate Inequality C. P. Chandrasekhar and Jayati Ghosh
Historically, today’s developed countries are responsible for nearly 80 per cent of global cumulative carbon emissions over 1850 to 2011. The climate change impacts that the world is facing today are fundamentally a result of that over-exploitation by a small group of now-rich countries, which account for only around 14 per cent of global population. However, the advanced economies have succeeded in shifting the terms of negotiation away from any notions of historic responsibility and climate debt, to current emissions levels.
Recent changes in economic growth patterns have meant that in 2019, developing countries were responsible for 63 per cent of annual emissions. The three largest emitters of CO2 today are China, the USA and India, which together account for more than half of global CO2 emissions. This is what made the recent COP26 Summit in Glasgow so intense, especially in terms of finger pointing at China and India. Both of these countries, and China in particular, have both shown dramatic increases in emissions especially since the turn of the century, while the largest carbon-emitting advanced economies have shown lower increases and in some cases, slight declines.
However, a closer look at the data suggests that even in current terms, the inequalities in carbon emissions remain very significant, and that the standard indicator used by the UNFCCC and in climate negotiations, of carbon emissions produced within that country, may not be the most relevant.
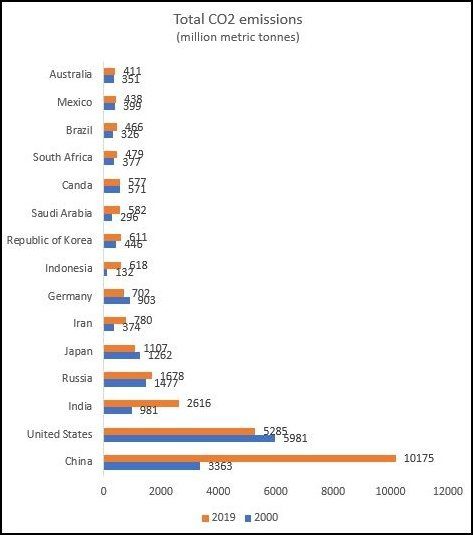
Figure 1 shows the change in total emissions produced in the biggest emitters between 2000 and 2019. It is evident that while the top 15 largest emitters have remained the same, their ranking has changed considerably over this period, with the previously largest emitter the United States falling into second position below China, and India moving up from fifth to third position. Developing countries clearly showed much faster rates of increase of carbon emissions in this period: in China they went up by more then 3 times, in India by 2.7 times, in Indonesia by 4.7 times and in Saudi Arabia they nearly doubled.
Meanwhile, in the United States and Japan, total national production-based emissions actually declined by around 12 per cent over these two decades—and in Germany the decline was nearly 22 per cent. These declines reflect a combination of forces: changes in trade patterns that enabled these countries to shift the more carbon-intensive production to other (mostly developing) countries and thereby effectively “export” their carbon emissions; changes in economic structure towards services that rely less on energy use: changes in the composition of energy away from the most polluting sources (like coal and natural gas) to less polluting sources like nuclear and renewable energy.
Figure 1

Source: https://unctad.org/news/carbon-emissions-anywhere-threaten-development-everywhere, based on data from the Global Carbon Project.
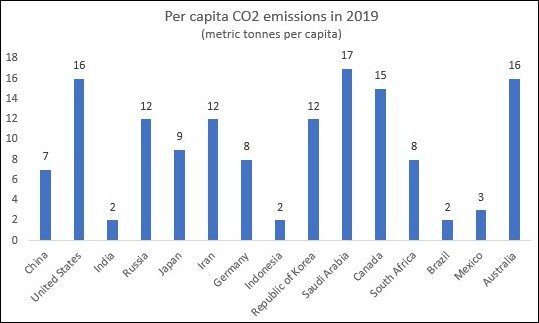
Despite these changes, in per capita terms, the advanced economies still remained by for the greatest emitters. Figure 2 shows that in per capita terms, the USA and Australia showed 8 times more carbon emissions than developing countries like India, Indonesia and Brazil, who are nevertheless being castigated for allowing emissions to increase. Even China shows less than half the level of per capita carbon emissions of the USA.
Figure 2

Figure 3

However, even per capita carbon emission comparisons that are based on national production are inadequate and do not reveal the full extent of the inequalities that currently exist. That is because of the changes in trade patterns mentioned earlier, whereby advanced economies followed the now-infamous strategy proposed by Larry Summers, of exporting polluting industries to the developing world—and adding carbon-emitting industries and production processes to this list. Effectively, several advanced economies began to outsource carbon-intensive industries, importing the related products, and shifted to emphasising value added creation in less polluting activities.
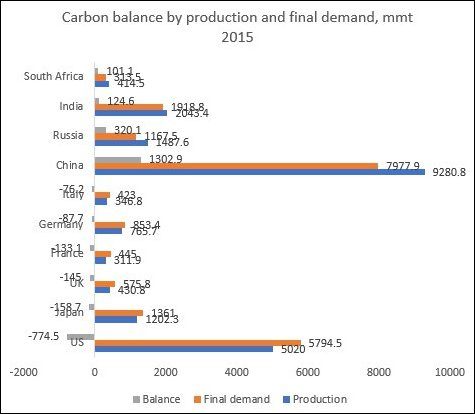
There are some calculations of this process by the OECD, based on the construction of Global Multi-Regional Input Output (GMRIO) tables with environmental extensions. These calculations provide assessments of carbon emissions based on final demand (consumption plus investment) and the carbon balance achieved through trade, which includes carbon emissions during production (including export production) minus those in the imports. These calculations suggest that the process of exporting emissions by OECD countries grew rapidly from 2002 (notably, after China joined the World Trade Organisation) and peaked in 2006 at a negative carbon balance of 2278 million metric tonnes, which was 17 per cent of the OECD’s production-based emissions. They have been declining thereafter, but still remain at around 1577 mmt. Figure 3 provides some indication of the extent of this carbon balance in 2015 for some major countries, as well as the role payed especially by China in enabling this process.
Figure 4

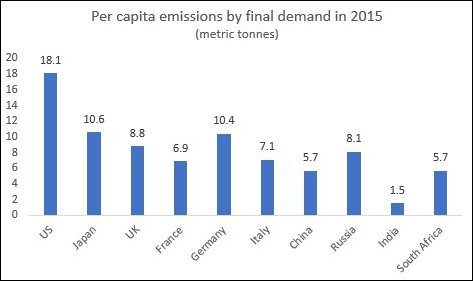
Once final demand emissions are taken into account, the per capita differences across countries show up as even greater. While the US showed 8 times the per capita carbon emissions of India in production terms in 2019, when final demand emissions are calculated for 2015, the US emissions were more than 12 times that of India. Even with respect to China, US per capita emissions based on final demand were more than 3 times.
Final demand (or consumption-based, as they are often described) emissions expose the problems with looking at carbon emissions only from the producer perspective, and highlight the principle that it should not be only the producer but rather the user, who pays for the cost of such emissions.
What is the best way of dealing with this? Advanced countries have recognised this gap, and are proposing to address this through trade measures. The current responses are in terms of higher cross-border taxation of carbon-emitting goods and moving towards a global carbon price that would deter certain kinds of carbon-intensive investment and production. This amounts to taxing developing country producers to make low carbon technologies in developed countries competitive. The problem is that in its current form, this strategy is essentially protectionist and counter-productive, in that it is likely to penalise developing countries without enabling or assisting alternative green economy trajectories.
Most critically, such proposals are not accompanied—as they necessarily must be—by much greater levels of climate finance that would enable the required shifts in production capacities in the developing world. They are not accompanied by measures that would regulate the way private finance (mostly from institutions based in the Global North) continue to prioritise “brown” investments in developing countries. The critical issue of the constraints posed by the WTO’s intellectual property rights regime to more “green” investment in the developing world is not recognised nor sought to be addressed. Instead, advanced country governments enable knowledge monopolies of large private corporations that make access to crucial technologies too expensive and unaffordable in the developing world. When developing countries seek to encourage renewable energy technology development through subsidies to their own producers, they face cases in the WTO brought by the US and others.
In such a context, bringing in trade policies that sound environmentally sensitive but are essentially protectionist in nature would serve little purpose in the larger aim of climate mitigation. It will also add to the pervasive lack of trust that has been created by recent actions of developed countries, as a result of vaccine monopolies and reneging on earlier promises of climate finance. A more holistic approach that incorporates finance and technology transfer is essential for the international cooperation that the world needs at this juncture.
(This article was originally published in the Business Line on November 29, 2021)
