The weaponization of tariffs by US President Donald Trump has clearly generated fear and loathing…
National Income in India: What’s really growing? Jayati Ghosh
In India, we tend to obsess a lot about the growth rate of national income, worrying if it drops even a tenth of a percentage point below market expectations, and checking fiscal and monetary indicators with respect to the value of the national product. By contrast, we worry much less about the quality of that growth, or even its sectoral distribution. But surely the latter is more important, both for the conditions of people and the overall health of the economy now and in the future.
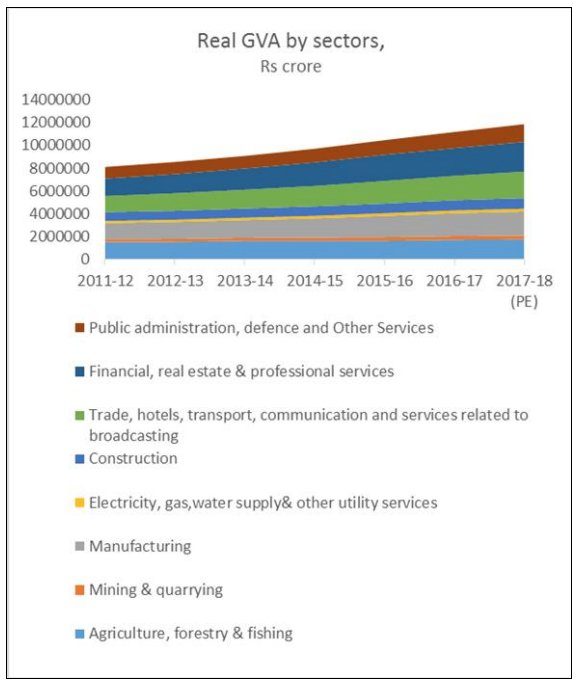
Consider how the different productive sectors have grown in terms of real value added (that is, in constant price terms) since 2011-12, since when the new series of national income data are available.
Chart 1 shows that the service-led trajectory of the Indian economy continues, while some of the more significant sectors from the point of view of employment and infrastructure have lagged behind. The FIRE sector (finance, insurance, real estate along with other professional services) increased by 22 per cent over this 7-year period (referring to the total increase between 2011-12 and 2017-18), while trade, hotels, transport, communication and services related to broadcasting increased by 19 per cent. By contrast, value added in agriculture, forestry and fishing went up by only 14 per cent and core and basic industries like electricity, gas, water supply and other utility services increased by only 2 per cent over the entire period. Value added in manufacturing rose by nearly 18 per cent, based on data from corporate industry rather than the industrial production index.
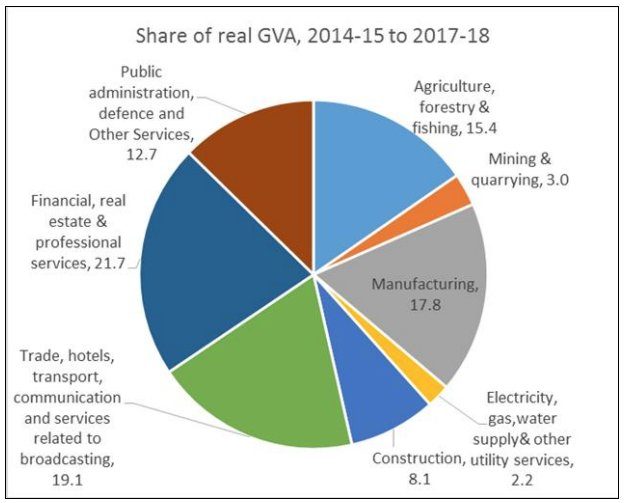
As a result, as indicated by Chart 2, services have accounted for around 54 per cent of GDP in the last few years, and specifically during the tenure of the Modi government. But all services still cover only around a quarter of employment – and the bulk of those jobs are in low paid and productivity services (like pakoda selling) rather than the professional services that are expanding most rapidly in income terms. The primary sector, which continues to employ well over half the recorded work force, accounts for only around 18 per cent of GDP. Meanwhile manufacturing remains largely stable in terms of both income and employment shares, at around 18 per cent.
Chart 1: Services continue to be the most dynamic sectors

Chart 2: Services are now nearly 54 per cent of GDP

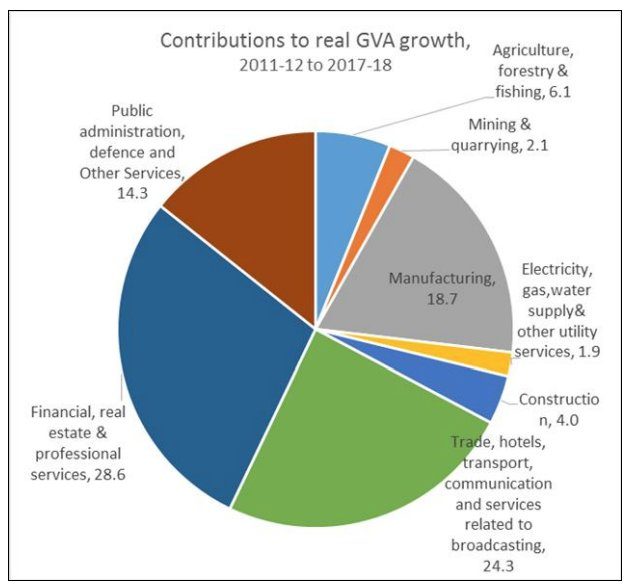
This skewed nature of growth has accentuated even further in this decade. Chart 3 describes the contributions of the various sectors to the aggregate growth of national income over the period since 2011-12. It shows that the three main services sub- sectors (FIRE and professional services, trade, hotels, transport and communication etc., and public administration and defence) accounted for 67 per cent of the growth in national value added since 2011-12. In fact, 43 per cent of the GVA growth came from only the latter two sectors a worrying trend indicative of a bubble economy. In this decade so far, the contribution of agriculture forestry and fishing has been only 6 per cent, and even construction – which was a very dynamic sector in the previous decade contributed only 4 per cent to total growth.
Chart 3: Services accounted for more than two-thirds of income growth in this decade

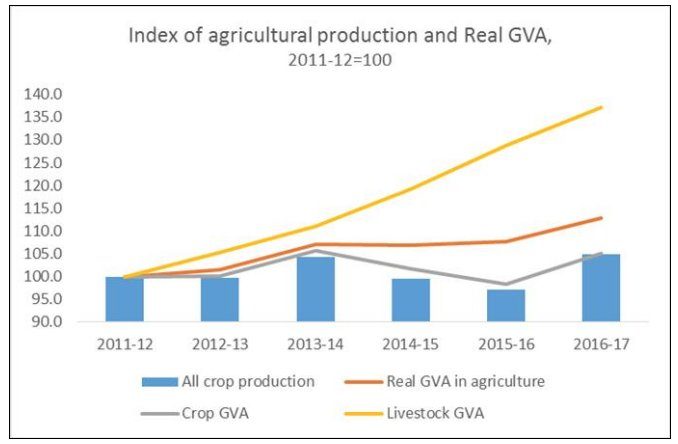
A more detailed consideration of agriculture GVA provides some insight into the concerns of farmers who are now protesting across the country because of the lack of
viability of cultivation. Chart 4 shows the index numbers of crop production, as well as agricultural GVA in both crops and livestock. It is clear that crop production has generally languished since 2011-12, falling sharply for two years after 2013-14 and recovering only to that level in 2016-17. The value added in crop production has similarly been stagnant, and in 2016-17 was still slightly below the level reached in 2013-14.
What emerges is that farmers have essentially been saved by rearing livestock, which is the segment that has grown in terms of real value added and thereby enabled some increase in farm incomes over the period, even though this increase is still well below the growth of incomes in other sectors. By 2016-17, income from livestock accounted for 30 per cent of agricultural incomes.
Chart 4: Agricultural income has been saved by livestock as crop production languishes

This points to two areas of concern for policy makers. First, crop production and real incomes from cultivation are both stagnating in a way that suggests real crisis and distress in rural areas. Second, the livestock economy, that has become such a mainstay for farmers to enable them to survive, needs to be protected and nurtured. This in turn means that the economic viability of livestock production should not be threatened by unchecked social forces like violent cow vigilantism that have threatened the lives and livelihood of livestock breeders and traders.
Looking beyond the aggregate numbers to the pattern of growth thus makes it evidentthat the trajectory of economic expansion is both deficient and unsustainable.
(This article was originally published in the Business Line on February 27, 2018.)
