The weaponization of tariffs by US President Donald Trump has clearly generated fear and loathing…
A Curious Divergence C.P. Chandrasekhar and Jayati Ghosh
As is widely recognised, India’s economic growth since the 1990s has largely been on account of an expansion of the services sector, in which exports are seen as having played an important role. The rise in the share of services in GDP was particularly sharp after 1996-97 amounting to 6.8 percentage points over the subsequent ten years as compared with just 1.9 percentage points during the previous ten years. In the event, services as a group came to dominate the Indian economy, accounting for more than half its GDP. The official Economic Survey 2013-14 noted that: “India has the second fastest growing services sector with CAGR (compound annual growth rate) at 9 per cent, just below China’s 10.9 per cent, during the last 11-year period from 2001 to 2012.” This trend has continued. Between 2011-12 and 2016-17, gross value added from services grew at 8.7 per cent per annum and accounted for 58 per cent of the increase in total GVA.
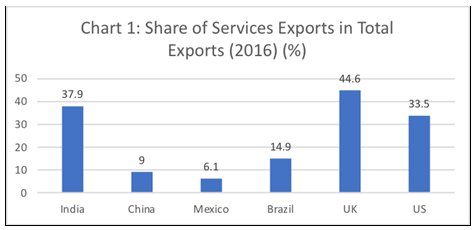
This growth in services has been accompanied by a significant increase in the exports of services from India. India’s success in the services exports area has meant that its share of services in total exports (38 per cent) is much higher than in countries such as China, Mexico and Brazil and close to ratios in the UK and the US (Chart 1). That success has raised India’s share in world services exports from 0.6 per cent in 1990 to around 3.5 per cent in 2017.

The normal presumption that follows is that diversification into high productivity, and in some cases tradable, services accounts for India’s premature increase in the relative share of services in total GDP. However, India’s National Accounts Statistics indicate that the set of “new” and more productive services—transport, storage and communication, financial services, and real estate and professional services—together accounted for only 28.5 per cent of total gross value added (GVA) in 2016-17. Add on public administration and defence and the railways and the figure rises to 34.2 per cent. That still leaves close to half of the 65 per cent share of total GVA from services unaccounted for. Trade, repair services and hotels and restaurants, dominated by the retail trade, alone account for 11.1 per cent of GVA and ‘other services’ for another 6.9 per cent.
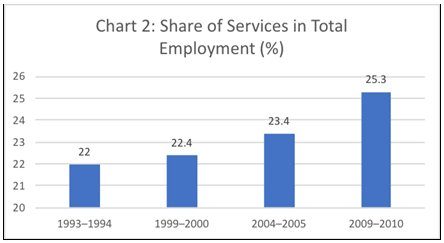
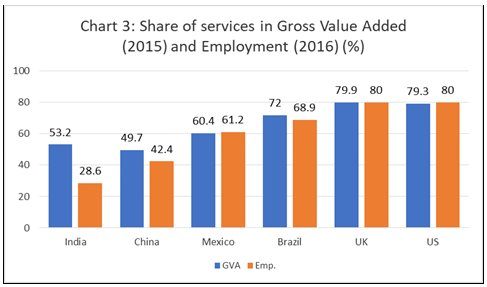
This composition suggests that, while ‘new’ modern services do play an important role in the Indian economy, so do traditional unorganized services, which are known to be characterized by extremely low earnings, and which grow because of the inadequate employment opportunities in the primary and secondary sectors. However, what is striking is that, despite the presence of unorganised services, the share of the services sector in total employment was relatively low, and despite the expansion of services, the growth of employment in this sector has been limited. Between 1999-00 and 2004-05, employment in the tertiary sector increased by only 22 per cent, whereas GDP at constant prices contributed by the services sector expanded by 44 per cent. Tertiary sector employment in 2009-10 amounted to only 25 per cent of the work force, despite the fact that around 55 per cent of GDP came from this sector (Chart 2). An examination of the sectoral composition of the workforce across the quinquennial surveys of the National Sample Survey Organisation reveals that the share of services in employment increased by far less than the huge increase in its share in GDP. In fact, as Chart 3 illustrates, India is unusual in terms of the wide divergence of the shares of the services sector in total gross value added and employment. As compared with 50 and 42 per cent in China, 60 and 61 per cent in Mexico, and 72 and 69 per cent in Brazil, the GVA and employment shares in India were 53 and 29 per cent. According to The Economic Survey 2016-17: “Among the top 15 services producer countries, the services sector accounts for more than two-thirds of total employment in 2016 in most of them except India, China and Mexico where the shares are low. India has the lowest share of 28.6%.”

If the economy muddled along despite this failure of its most dynamic sector to make an anywhere near proportionate contribution to employment relative to its contribution to value added, it was because of a substantial increase in employment in the construction sector. Total employment in the construction sector rose from 17 million in 2000 to 50 million in 2011–12, doubling over the years from 2004–05, mainly because of increased employment in rural construction. In the event, the share of the construction sector in total employment rose from 4.4 per cent in 1999–2000 to 10.5 per cent in 2011–12.
The weak responsiveness of employment to an increase in services production is possibly because high productivity services contributed so little to employment, that even significant low wage employment in traditional services that contribute little to GDP could not restore a semblance of proportionality between employment and output growth. For example, within the modern services, financial intermediation and real estate, renting and business activities together recorded an increase in employment share of only one percentage point between 1999-00 and 2009-10. These are the ‘boom’ sectors that have generated the new rich of post-reform India.

Even the much-celebrated growth of IT and IT-enabled services has not been accompanied by a proportionate growth in employment. According to a study by the Central Statistical Organisation the share of ICT services in total GDP had increased from 3 per cent in 2000-01 to 6 per cent in 2007-08; and in service sector GDP it went up from 6 per cent in 2000-01 to 10 per cent in 2007-08. On the other hand, going by NSS figures, employment in computer related activities (Category 72 of National Industrial Classification) which increased from 314 million in 1999-00 to 963 million in 2004-05, accounted for 0.2 per cent of the work force. That figure rose to just 0.4 in 2009-10. If we consider categories 65 to 74 which covers all business services including financial intermediation, and real estate, renting and business activities, the share of employment in that sector was just 1.7 per cent in 2004-05 and 2.2 per cent in 2009-10. This explains in large measure the lack of correspondence of the shares of services in GDP and employment.
If a high growth sector like services does not contribute to absorbing the large numbers of under- and unemployed workers in India, the welfare implications of the growth trajectory are bound to be adverse. This is a factor that is ignored by those who laud India’s alternative growth model, which involves premature diversification in favour of high productivity services, without adequate development of a manufacturing base.
(This article was originally published in the Business Line on November 19, 2018)
