The World Bank and the IMF Spring meetings begin this week in Washington. And with…
Haemorrhaging Zambia: Prequel to the Current Debt Crisis Andrew M. Fischer
Following a stand-off with commercial creditors and protracted but unresolved negotiations with the IMF, Zambia defaulted on its external sovereign debt on 13 November this year. While most commentary has focused exclusively on the government’s sovereign borrowing, our own research has detected massive outflows of private wealth over the past fifteen years, hidden away on an obscure part of the country’s financial account. The outflows are most likely related to the large mining companies that dominate the country’s international trade. With many other African countries also facing debt distress, the lessons of this huge siphoning of wealth from the Zambian economy need extra attention within discussions about debt justice in the current crisis. We explain here what we’ve found.
Zambia was already debt-stressed going into the COVID pandemic. The economy was hard hit following the sharp fall in international copper prices from 2013 to 2016, especially that copper made up about 72% of its exports in 2018 (including unrefined, cathodes and alloys). Following a severe currency crisis in 2015, the government entered into negotiations with the IMF but never agreed on a programme. There was some improvement in macroeconomic outlook in 2017 due to rising copper prices, which sent international investors throttling back into optimism. However, international investors again turned against the country in 2018 in the midst of the global emerging market bond sell off, which compounded the effects of severe droughts in 2018-19. As a result, the government was already teetering on the edge of default on the eve of the COVID-19 pandemic. The economic fall-out of the pandemic has since pushed the country over the edge (see an excellent analysis here).
Most of the commentary on Zambia’s default focuses exclusively on the government’s sovereign borrowing. Our own analysis peers behind this headline focus into the intricacies of financial flows into and out of the economy. Through this analysis, we have identified massive outflows of private wealth over the past fifteen years, reaching peaks of almost 20% of GDP in 2012, 15% of GDP in 2015, and over 7% of GDP as recently as 2017. The magnitude of these outflows thereby siphoned off most of the gains from both the commodity boom of the early 2010s and the government’s borrowing, undermining any hope for achieving external financial stability.
These outflows can be identified through an apparent anomaly on the financial accounts of the Zambian balance of payments that started with the debt relief of the Multilateral Debt Relief Initiative (MDRI) in 2005. The anomaly was a sharp rise in net acquisitions of debt instruments by resident non-financial ‘other sectors’ on the ‘other investment’ account. In other words, Zambian residents – which can include the local subsidiaries or affiliates of transnational corporations – were massively increasing their holdings of debt assets abroad even in the midst of debt distress at home.
What could such debt assets represent? Local subsidiaries of transnational corporations have been known to borrow heavily offshore, as is commonly discussed in the financialization literature.[1] However, such financial operations would appear as debt liabilities, not as debt assets, so this explanation does not make sense.
In exploring this puzzle during fieldwork in Zambia, we came to understand that the debt assets in question represent an accounting discrepancy that is mostly likely explained by unreported profit remittances by large mining companies in Zambia. Other corporates might have also been involved, although given the conventional wisdom that most things occurring on the external accounts of Zambia are somehow related to the mining majors, it follows that so too were the discrepancies. Regardless, they represent a massive siphoning from the economy at a time when the authorities have been desperately trying to sustain the economy.
Some background
It is important to note that the external accounts of Zambia exhibit the classic features of a poor primary commodity exporter dominated by foreign corporations. As outlined in my recent article, ‘Debt and Development in Historical Perspective’, such countries tend to run merchandise (i.e. goods) trade surpluses, at least during periods of commodity booms, although these surpluses are counterbalanced by service trade deficits (which are dominated by foreign firms) and primary income account deficits (due to interest payments on debt or profit remittances). As a result, the gains made in commodity exports are largely depleted by payments to the foreign firms that dominate, service and/or finance such exports. This is in contrast to classic developmentalism, such as in South Korea, which actually ran merchandise trade deficits supported by aid, service trade surpluses, and debt.
Zambia proves the rule. As shown in Figure 1 below, it ran strong goods trade surpluses in the commodity boom years, roughly from 2006 to 2014, but the country actually struggled with current account deficits even during these years because of deepening services deficits (which reflect the commodity trade given that they are dominated by freight transport) and persistent primary income account deficits. As a result, it only earned more limited current account surpluses for a briefer period, in 2006 and then from 2009-13.
Figure 1: Zambia, current account, 1997-2019 (millions current $US)
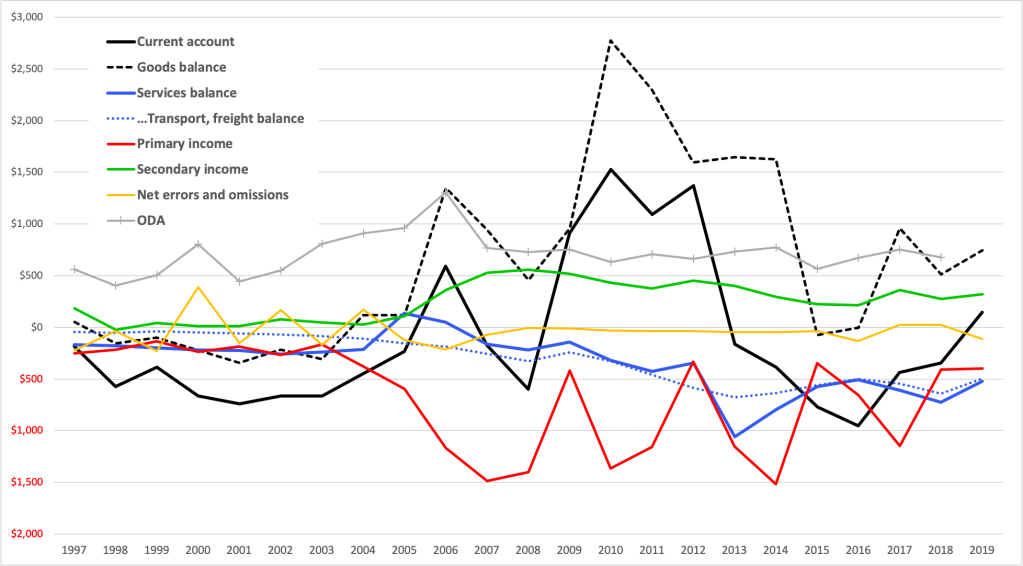
Source: IMF Balance of Payments Statistics (last accessed 22/11/2020) and OECD DAC for ODA data.
In the years when the Zambian merchandise trade and hence current accounts were both in deficit (e.g. 1998-2003, and 2015-16), this reflected deep economic recession and/or crisis. However, even in these contexts, service and primary income deficits continued to drain foreign exchange from the economy. For instance, as shown in Figure 2, deficits on the services and primary income accounts amounted to more than 5% of GDP each in the late 1990s and early 2000s, equivalent to most of the official development assistance committed to the country in those years (according to the OECD DAC).
Figure 2: Zambia, current account, 1997-2019 (percent of GDP)
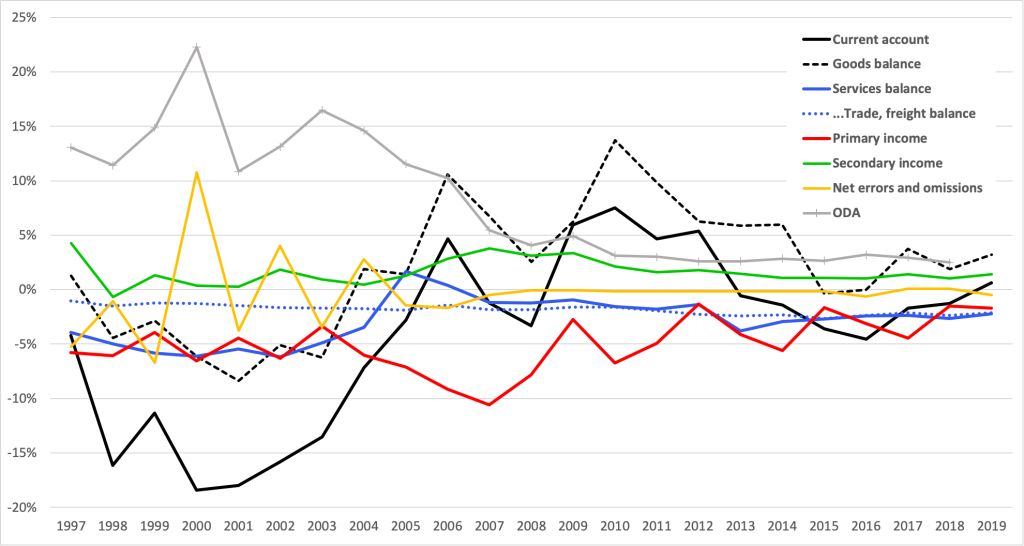
Source: calculated from IMF Balance of Payments Statistics and International Financial Statistics.
While debt relief in 2005 relieved much of the burden of interest payments on debt, remittances of profits earned from foreign direct investment (FDI) rose rapidly at the same time, more than counteracting the income effects of debt relief. As a result, the primary income account deficit actually increased following debt relief, reaching 10% of GDP by 2007. Some of this was reinvested (hence reappearing as FDI inflows on the financial account), although the amount that was genuinely remitted was still huge in international comparative perspective.
These dynamics reflect that the MDRI was synchronised with the resurgence of FDI into the continent by major transnational mining companies, which themselves were following the sharp rise in commodity prices at this time, e.g. copper prices skyrocketed from less than $1 USD per pound in the period between 1998 and mid-2003, to almost $4 USD per pound by spring 2006. Mining companies then remitted large amounts of their profits in subsequent years. This was facilitated by the financial account openness that had been pushed by the IMF and other international actors under the Highly Indebted Poor Countries initiative that effectively ended with the MDRI.
Already from this baseline view, Zambia benefitted little from the commodity boom in terms of mobilising foreign exchange for its development efforts, even considering the contributions of aid. However, at the very least, its current accounts appeared orderly, with errors and omissions at very negligible levels.
Financial account anomalies in the post debt-relief period
This orderly picture, however, needs to be broken down, especially on the financial account, where a lot of volatility underlies the aggregate balances. As shown in Figure 3, volatility includes large swings in FDI that have followed the commodity supercycle (the green line), the government’s short-lived forays into Eurobonds in 2012 and especially 2014-15 (the blue line), and other investment (the red line), which is mostly debt. The large surge in other investment in 2005-06 represents the MDRI debt cancellation. However, the massive surge from 2010-15 represents actual outflows from the economy.
Figure 3: Zambia, financial account, millions $US (current), 1997-2019

Source: same as above; note that this follows the BPM6 reporting, according to International Investment Position, hence a positive balance represents a foreign exchange outflow.
The above-mentioned anomaly can be found in the disaggregated other investment account. As shown in Figure 4 below, the surge in other investment outflows was due to a sharp rise in net acquisitions of debt instruments by resident non-financial ‘other sectors’ (the dashed green line). These debt asset acquisitions started at the same time as the MDRI debt relief, when this category jumped from non-existance in 2003 to over $600 million in 2005 and over $900 million in 2006, more than counteracting the gains of debt relief (note that cancelled multilateral debt was close to $2 billion in both 2005 and 2006 – the dashed red line in those years – although the actual gains from this were only accrued through reduced interest payments on debt, which only fell by $73 million USD in 2016 and $37 million USD in 2017).
These obscure debt asset purchases then jumped again to almost $1.5 billion in 2007 and, after a brief respite during the global financial crisis, peaked at over $5 billion in 2012, over $3 billion in 2015, and over $1.8 billion in 2017. While they subsided in 2018 and 2019 – to a level that was roughly equal to rising net general government borrowing (the dashed red line) – they had already reached over $1.3 billion in the first half of 2020 (based on the latest quarterly reporting; not shown in the figure). In proportional terms, these outflows were equivalent to almost 20% of GDP in 2012, almost 15% of GDP in 2015, and over 7% in 2017. The amounts also far exceeded the Eurobonds that were issued in 2012, 2014 and 2015 (worth $3 billion USD, the blue line), which are now the focus of default.
Figure 4: Zambia, selected other investment categories and portfolio liabilities, millions $US (current), 1997-2019
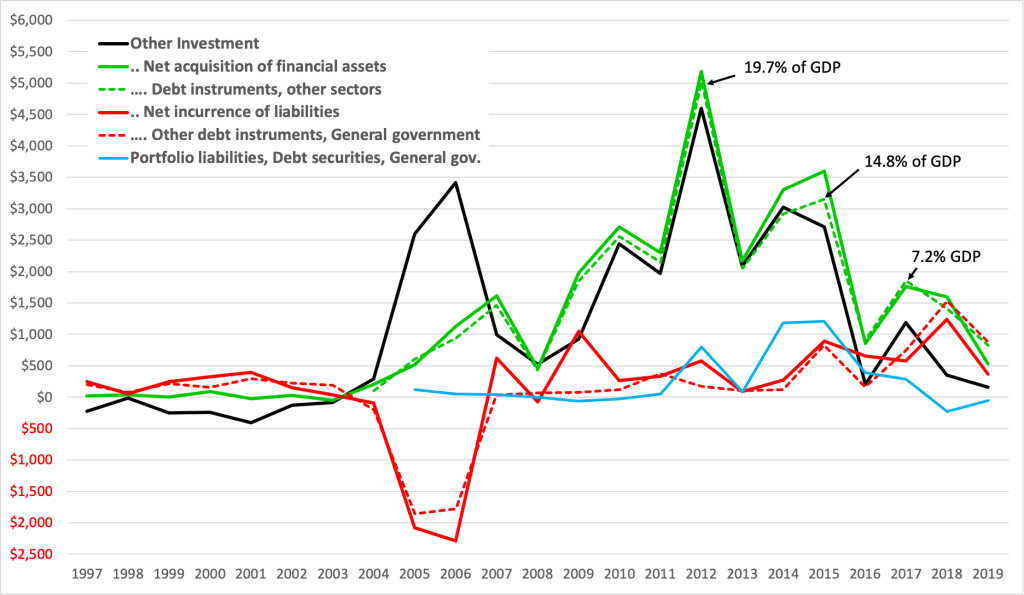
Source: same as above.
The monetary authorities in Zambia have been aware of this anomaly. At the time of our interviews in 2017,[2] they admitted to us that they had been trying to figure it out with the help of the IMF and suspected that it represents illicit or unreported remittances, most likely related to mining companies. It was not related to private capital flight through banks given that the banking sector is well regulated by the central bank (the Bank of Zambia or BoZ). In contrast, mining companies are not required to report to the BoZ given that they are non-financial firms and hence are not covered by banking regulations, even though they dominate much of the financial activity in the economy, especially on the external accounts.
Indeed, the anomaly itself was a creation of the BoZ based on their observation of discrepancies between their own data versus the reporting of assets held by Zambian residents by the Bank of International Settlements, to which international banks are required to report even when they fall outside Zambian jurisdiction. This led the BoZ to believe that the discrepancies belonged in this category of international debt assets. Technically, however, it should have been reported in the category of errors and omissions, although this would have of course raised alarm bells given the magnitude of these flows.
If we nonetheless treat the bulk of these discrepancies as profit remittances or their equivalent, then total profit remittances would rise to around 15-20% of GDP during the peak period from 2010-15, rather than around 5% as reported in the current account. They would have also been well above 10% of GDP as recently as 2017, rather than the 4.5% reported in the current account. Based on the most recent quarterly reporting, they would have reached these levels again in the first half of 2020 in the lead up to default.
The enormous sums involved relative to the economy – and relative to the $3 billion of sovereign bonds currently in default – provides a vital counterperspective to the rise of sovereign borrowing by Zambia. In effect, sovereign borrowing has helped sustain these private outflows, especially once the commodity boom came to an end. Foreigners have profited, much of the wealth of Zambia is now offshore, and yet the Government of Zambia has continued borrowing in a desperate attempt to keep the financial ship afloat despite these massive holes in its hull. Regular Zambians are now paying the price.
The argument for this economic model since the beginning of the century has been, to put it crudely, that Africans are better off being exploited than not being exploited at all, in terms of the extra jobs, investment, demand, and revenue that transnational corporations bring. With governments returning to the spectres of hard adjustment and deep recession, so soon after debt relief and commodity boom were squandered by massive outflows of wealth that open capital accounts facilitated, it is hard to see how this logic retains any credibility. More than just debt relief, a complete rethink of the model is required.
Andrew M. Fischer is Associate Professor of Development Studies at the ISS and the Scientific Director of CERES, The Dutch Research School for International Development. He tweets at @AndrewM_Fischer.
Photo: http://www.colnect.com/
[1] For instance, see Serena JM, Moreno R. 2016. ‘Domestic financial markets and offshore bond financing’. BIS Quarterly Review, September: 81-97. For more critical discussions, see Bortz PG, Kaltenbrunner A. 2018. ‘The International Dimension of Financialization in Developing and Emerging Economies’. Development and Change. 49(2): 375-393; or Kaltenbrunner A, Painceira JP. 2015. ‘Developing countries’ changing nature of financial integration and new forms of external vulnerability: the Brazilian experience’. Cambridge Journal of Economics. 39(5): 1281-1306.
[2] These must remain anonymised given the political sensitivity of these issues.
(This article was originally published in Developing Economics Website on November 24, 2020)