If a spate of recent headlines in the media is to be believed, the rupee…
The True Face of the Global Recovery C. P. Chandrasekhar and Jayati Ghosh
The global economy, the soothsayers would have it, is riding the back of a recovery. Growth is seen as having consolidated in the US, picked up remarkably in Europe, and returned, after a minor blip, in China and India. Encouraged by these signs, the IMF in January estimated global growth in 2017 at 3.7 per cent, which was marginally above previous projections, and forecast growth at 3.8 per cent in 2018 and 2019. A key driver here is the effect that the Trump administration’s tax cuts and promise of increases in infrastructure spending are expected to have on demand and output expansion in the US. Tight labour market conditions in the US, with unemployment at just 4.1 per cent, and prospects of inflation are seen as validating this judgement.
More significantly, the IMF buoyed optimistic sentiments by pointing to a dispersed recovery. To quote: “Some 120 economies, accounting for three quarters of world GDP, have seen a pickup in growth in year-on-year terms in 2017, the broadest synchronized global growth upsurge since 2010. Among advanced economies, growth in the third quarter of 2017 was higher than projected in the fall, notably in Germany, Japan, Korea, and the United States. Key emerging market and developing economies, including Brazil, China, and South Africa, also posted third-quarter growth stronger than the fall forecasts.” All indications are that the April World Economic Outlook will only endorse this assessment that the current recovery restores growth to where it was after governments opted for fiscal expansion in the immediate aftermath of the crisis, only to abandon it after 2010. Growth slowed then and did not respond to monetary policy measures such as liquidity infusion and near-zero interest rates. But, finally, now monetary policy seems to be working.

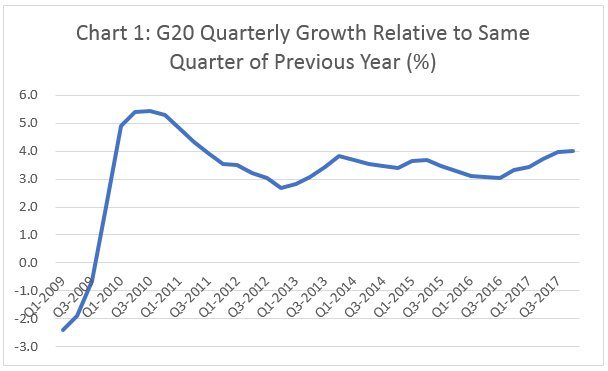
However, while signs of a pickup in GDP growth are visible, this assessment may be overly optimistic. As Chart 1 shows, if we take the G20 as a group, combined evidence from which must reflect the synchronised upturn, the recovery from a late 2016 low has taken the year-on-year quarterly growth rate to a level in the fourth quarter of 2017 that is not very much higher than that touched in the fourth quarter of 2013, and much lower than the peak recorded at the end of the immediate post-crisis recovery in 2010.

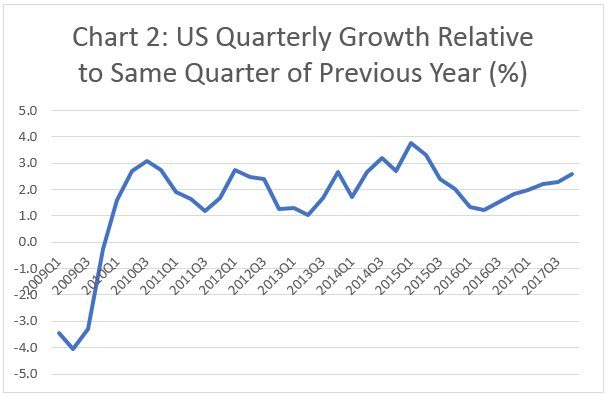
The record with respect to the United States is also similar. In fact, more sharply so. That is, the recovery in the US often referred to does not even return the quarterly growth rate to its previous post-crisis high (Chart 2). The year-on-year growth rate in the last quarter of 2017, was more than 1 percentage point below that recorded in the first quarter of 2015. What is more striking about the official evidence on the US economy is the sharp fall in the unemployment rate, from close to 10 per cent in the middle of the crisis to 4.1 per cent at the end of 2017. In fact, this rate is below even the 5 per cent that prevailed in January 2008, when the effects of the crisis had not yet been felt. However, the labour force participation rate, or those 16 years and above reporting themselves as available for and seeking work, had fallen from 66.2 per cent in January 2008 to 62.7 per cent in December 2017. This significant fall reflects the ‘discouraged worker effect’, where those unable to find work for long just drop out of the labour force.
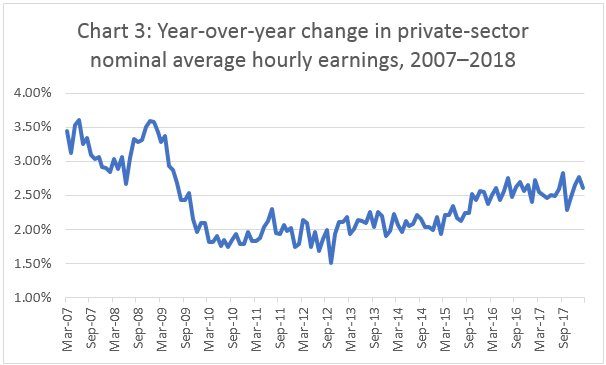
The fall, by reducing the size of the labour force relative to trend, and shrinking the denominator on which the unemployment ratio is calculated, results in an underestimation of unemployment. According to one estimate, if the labour force participation rate in December 2017 was the same as in January 2008, the corresponding unemployment rate would have been 6.1 per cent. Partly for this reason and partly because jobs being created in the post-crisis period are casual and precarious, nominal wage growth has been relatively flat, despite the ‘tightening’ of the labour market as reflected in the low unemployment rate, and way below its pre-crisis high (Chart 3). The net effect of this, when combined with cheap imports from abroad and subdued oil prices, is that the US inflation rate remains below the Fed’s target. According to calculations by the Economic Policy Institute, “Until nominal wages are rising by 3.5 to 4 percent, there is no threat that price inflation will begin to significantly exceed the Fed’s 2 percent inflation target.”

In sum, celebrations over the US recovery, which is seen as leading the synchronised global upturn are a bit premature. The recovery is not yet robust; nor is there reason to believe that, even if it persists, it would be restore pre-crisis growth rates and resolve the problems inherited from the crisis. This prognosis is supported also by an analysis of the factors that stimulate the recovery, despite the fact that governments in advanced countries and most emerging markets are resolutely sticking to a conservative fiscal agenda, and refusing to return to the proactive fiscal policies adopted in the immediate aftermath of the crisis.
One important stimulus for the recovery has been debt-financed private expenditure. Even before the process of deleveraging to wind down the large debt accumulated prior to the 2008 crisis could be completed, it was reversed, leading to a renewed rise in the volume of debt. Outstanding private debt rose significantly to stand at 1.3 times its first quarter 2010 level in the fourth quarter of 2017. Between mid-2007 and end-2013, household debt balances fell at the rate of 0.5 per cent per annum; but between the first quarter of 2014 and the fourth quarter of 2017, they grew at the rate of 0.8 per cent per annum. The corresponding figures for growth of the outstanding debt of non-financial businesses were 0.3 and 1.5 per cent. Strikingly, the revolving debt of households (largely credit card debt) rose by $120 billion or by 13 per cent between January 2916 and February 2018, to touch a record $1,031 billion.
This suggests that even the modest and hesitant recovery now being observed has been riding on a credit bubble similar to the kind that led up to the crisis of 2008-09. This has been driven by the cheap liquidity infused into the system by the easy money and low interest rate policies adopted by developed country central banks as a panacea for the crisis. Financial institutions burdened with liquidity were willing to lend, to avoid being penalised with low interest rates on deposits with the central bank. It was also facilitated by the return of borrowers to the debt market, encouraged by the boom in equity and real estate markets.
The boom has hugely inflated the ratio of net worth to disposable incomes in the households and non-profit organizations sector. That ratio stood at a high of 623 per cent before the crisis, in the last quarter of 2007, fell to 506 per cent in the depth of the crisis in the first quarter of 2009, and has since risen, slowly at first and rapidly after 2012 to touch 679 per cent in the last quarter of 2017 – significantly higher than it was before the onset of the 2008 crisis. This inflation in the value of household net worth appears to have once again encouraged debt financed spending by the private sector through the wealth effect. It is this debt financed expenditure that underpins the still weak recovery visible 10 years after the crisis first broke.
But, as the experience of a decade ago demonstrated, growth of this kind is clearly unsustainable. Capitalism relies on it because it has no other options at hand.
(This article was originally posted in the Business Line on April 10, 2018.)
